Data of provenances growth
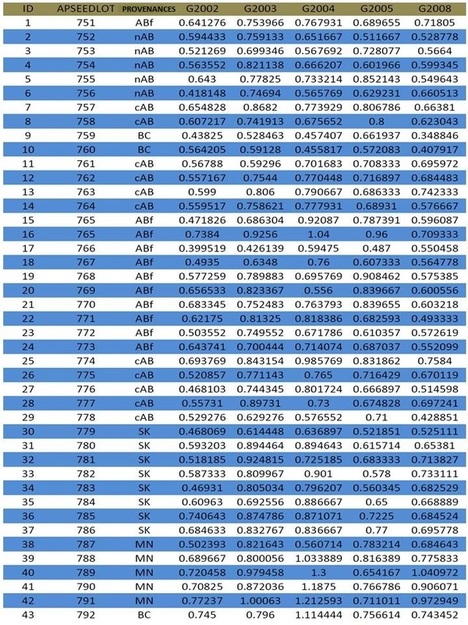
Table 2. Data of provenances growth over 6 years. G 2002 indicates average provenance growth for period of 2002. G 2003 indicates average provenances growth for period of 2003. G 2004 indicates average provenances growth for period of 2004. G 2005 indicates average provenances growth for period of 2005. G 2008 indicates the average provenaces growth for period of 2008.
Variation in provenances growth
Annual mean growth of provenances was compared to show variation in growth pattern. Preliminary results indicate that provenances treatments show different growth during different period of time. This can be verified in (Fig. 2) that shows MN provenance perform better for all period of time than other provenances except 2005 that shows reduction in growth of MN provenance. Results also indicate that provenance ABf shows more growth for period of 2005 than other provenances. These results can further be verified in (Fig. 3) that shows MN and SK provenance show more reduction in growth for the period of 2005 than other provenances and ABf shows increase in growth as compared to others.
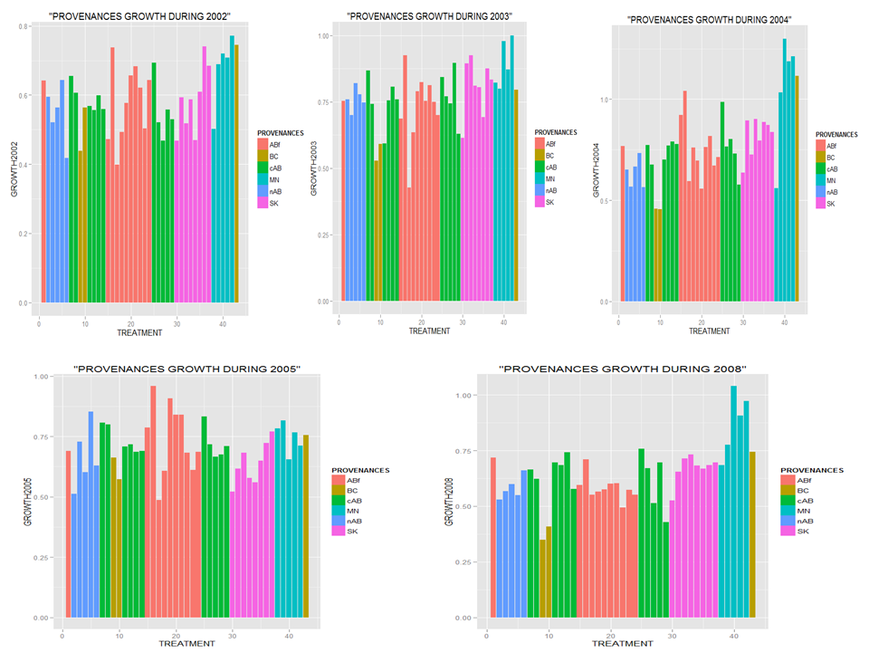
Fig. 2 Bar plot showing annual mean growth of provenances treatments over 5 years.
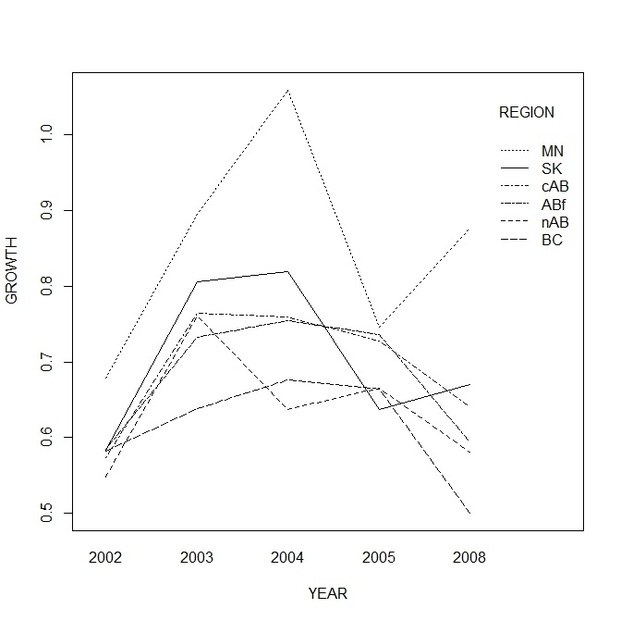
Fig. 3 Interaction plot of provenances growth during 2001 to 2008
Provenances growth and climate pattern
Aspen growth, like other forest tree species is influenced by different climate variables, such as temperature and precipitation. Provenances growth rate might be expected to be higher during higher precipitation with lower temperature. Figure.4 shows mean summer temperature and mean monthly precipitation for period of 2002 to 2008. It shows that precipitation increase from 2002 to 2003 and decrease from 2005 to 2008. It also shows that there is a fall in temperature from 2003 to 2005 and rise in temperature from 2005 to 2008. It also shows that during 2004, temperature and precipitation are normal. By comparing provenances' performance under different climatic conditions, it shows that MN and SK provenance show more growth during 2002 to 2003, as compared to other provenances. It also shows that MN and SK provenance show the highest growth during 2004. During 2005, MN is showing higher reduction in growth followed by SK, but at the same time, ABf is showing little increase in growth. By comparing provenances growth during 2008, it shows that MN is showing the highest growth followed by SK, but other provenances are showing reduction in growth.
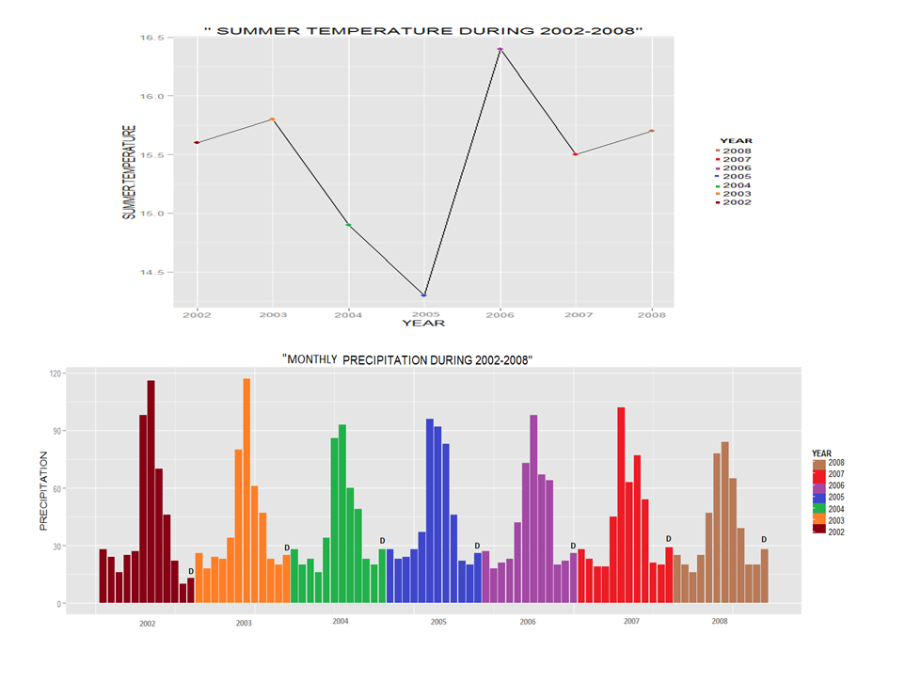
Fig. 4 Bar plot showing monthly precipitation and line plot showing summer precipitation of experiment site.
